|
Home Page | Map and Climate | Sunshine Studies | Sequim Weather | Sequim Webcam | Activities | About
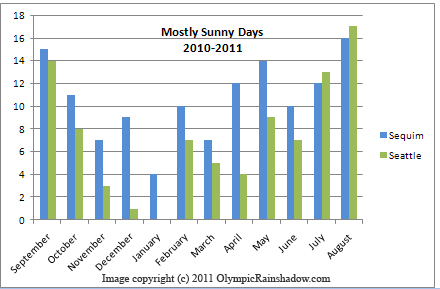
Annual Days of Sunshine Report: Downtown Seattle vs. Olympic Rain Shadow, Oct 2010-September 2011
This report is a comparison and analysis of the sunshine in downtown Seattle, Washington vs. areas, including Sequim, located in the Olympic rain shadow. The number of sunny days per year in Seattle is reasonably well understood and documented, but the corresponding data for Sequim, or for that matter, any location in the rain shadow, had not been measured to our knowledge prior to this study. We used recorded solar radiation to estimate sky conditions using a sophisticated algorithm we put together and refined during the yearly study.
Report Highlights:
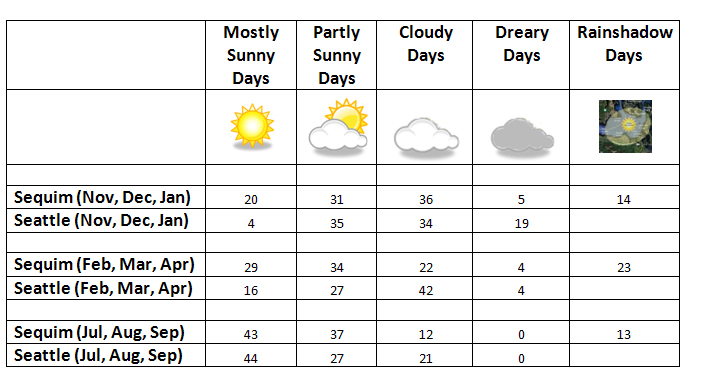
(note, a "rainshadow" day is a cloudy or dreary day in Seattle when is it partly or mostly sunny in Sequim or Port Angeles) However, it was on a seasonal basis where the more dramatic variations arose.
During the darkest and stormiest winter months of November through January,
Sequim recorded 51 of 92 days at least partly sunny, with 20 mostly sunny days,
and only 4 dreary days. During this same period in downtown Seattle, only 4 of
92 days were mostly sunny, with 19 dreary days. It is important to note that
during this period, there were stretches of days where there was "not place to
run, no place to hide". For example, January in Sequim was particularly bad,
with only4 mostly sunny days, and 20 out of 31 days cloudy or dreary.
But right on the heals of January, the rain shadow really kicked into gear
during the early spring months of February through April, In Sequim, 63 of 89 days were at least partly sunny. March in particular was a very
stormy and dark month in Seattle, with 18 of 31 days cloudy, while Sequim
recorded only 8 such days. While this report focuses on Sequim vs. Seattle, thanks to Lincoln High School, we also analyzed Port Angeles weather at the same level of detail as Sequim and Seattle. On an annual basis, Port Angeles recorded virtually the same number of mostly sunny days as Sequim and nearly identical the overall solar radiation; so Port Angeles is most definitely “in the shadow”. However there were some seasonal differences between the two locations. For more detail, see our page on Port Angeles Sunshine.
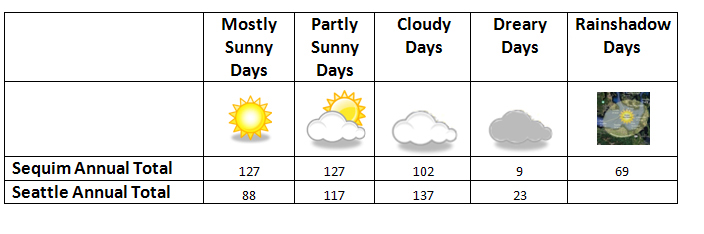
Report Conclusion
The Olympic rain shadow has a dramatic impact in the amount of incident light and number of sunny days recorded in locations like Sequim when compared to downtown Seattle. The weather differences are most pronounced during the winter and spring seasons. Port Angeles also benefits strongly from the rain shadow, as do likely other areas such as Victoria, the southern San Juan Islands, and western Whidbey Island. While this study focused on downtown Seattle, it is highly likely, if not certain, that many suburban areas of Seattle, especially those to the east, are even more dramatically less sunny than Olympic rain shadow areas during the winter and early spring.
Monthly Totals 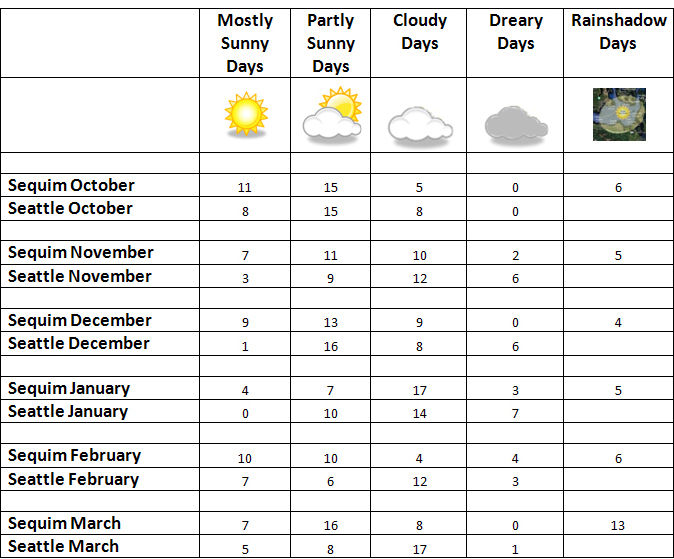 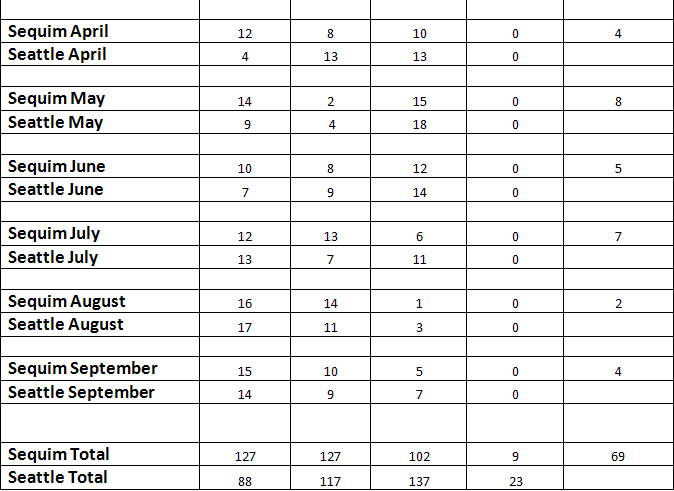
We also have archived monthly rain shadow climate summaries and individual monthly reports with daily sunshine charts and radiation plots. Study Methodologies, Weather Stations, etc. The studies and live sunshine conditions on this website are based on examining incident solar radiation. Solar radiation is measured in watts per square meter (w/m^2). Solar radiation is directly related to illuminance, a measure of how much light falls on a given area. Live sunshine conditions are calculated as follows:
“Bright
Sunshine” sensors record at least 60% of the maximum radiation possible
for that day of that year Days are categorized as follows:
"Mostly
Sunny" over ½ the day had at least “partial
sunshine”, with at
least 22% of daylight hours “bright sunshine”.
The website uses data from four different weather stations. The first station, the Sequim station, is located on the roof of a single story home on Jamestown Beach Rd, in Sequim, directly on the shores of the Strait of Juan de Fuca. This location may be very close to the epicenter of the Olympic Rain Shadow. As with many locations on the Dungeness plain in Sequim, this one is not shaded by tall trees, nor does it have any hills affecting its exposure. When the sun rises in the morning, it clears the horizon almost immediately as the areas to the south and east are open water. When the sun sets in the evening, it sets to the west, over the Dungeness plain, so stays above the horizon for quite some time. The Sequim location uses a Davis Instruments Vantage Pro 2 with optional solar sensor. This station measures solar radiation every 2 minutes and records the average over 10 minutes. The second station is in downtown Port Angeles, at Lincoln High School. The school's Davis Instruments Vantage Pro2 Plus sensors are mounted on the rooftop of the high school, about a mile southwest of ferry dock to Victoria B.C. at an elevation of about 200 feet. There is excellent exposure clockwise from northeast to southwest and good exposure for the other directions. The sensors record solar radiation every five minutes. Special thanks to Peter Alexander, his math classes, and Lincoln High School for the data and support.. The third station is atop the Atmospheric Sciences Department building of the University of Washington, in the University District of Seattle. This seven story building is not in the classical Olympic Rain Shadow area, but is still slightly shadowed by the Olympics. Given that the sensor is located atop a tall building, this location has ideal exposure and receives maximum solar radiation. This station records solar radiation every minute. Data was retrieved by downloading public information from the University of Washington’s Department of Atmospheric Sciences website. The fourth station is in downtown Port Townsend at a private residence. The Davis Instruments Vantage Pro 2 Plus with option solar sensor is located on the roof of the home and has clear exposure to all directions. It elevation is roughly 100 feet above sea level, and it is about 1/4 mile from the shoreline. For the year long study, we made a number of improvements to our model which estimates sky conditions from solar radiation. First, we and others noticed that the UW equipment in Seattle was uniformly recording lower radiation than the two other stations, even on completely clear, sunny days. So we normalized the radiation on the Y axis such that that all stations were recording nearly identical radiation on clear sunny days. This reduced, but in no way eliminated, the advantage rain shadow locations had over Seattle. Next, we made our seasonality model much more sophisticated. Originally, we used radiation and "bright sunny hours" thresholds computed on a monthly basis to estimate sunny days. The problem is those thresholds are very different at the beginning of a month like February than at the end. So we moved to a daily threshold for these values, which is much more accurate. This change made the model more accurate, but did not change overall comparative results dramatically. Finally we compared our model's results for Seattle to the National Weather Service evaluations of average daily sky conditions to check for consistency. The weather service categorizes days as on average as, "Cloudy", "Partly Cloudy", or "Clear", based on automated hourly observations. We found that our totals for cloudy, and the sum of partly and mostly sunny days, lined up quite well with their observations; however, our category of "mostly sunny" is a little broader than their category of "Clear". Overall though, the consistency was encouraging. Of course the weather service only does sky condition summaries for a small number of cities, none in locations such as Sequim, Port Townsend, or Anacortes, so that is why we went with the radiation approach. Study data was aggregated, analyzed, and graphed using Microsoft Excel.
|
|
|