|
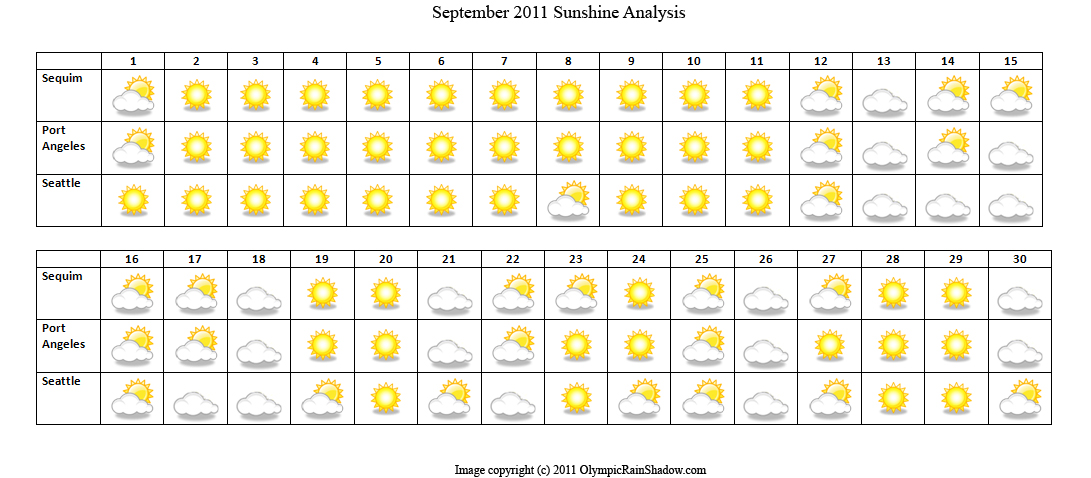
Home Page | Location and Climate | Sunshine Studies | Meteorology | Sequim Weather | Sequim Webcam | Resources | Blog | Photo Gallery | About September 2011 Sunshine Analysis ¢ Olympic Rain Shadow vs. Downtown Seattle Our 12th monthly study examines the month of September, 2011 and sunshine data from three different weather stations, one located in Sequim, one in Port Angeles, and one in Seattle. September in the Pacific Northwest is typically a transition month from summer to fall weather. This September was a dramatic example of how rapidly that transition can take place. The first eleven days of the month were hot and sunny, with all stations recording more than 10 sunny days, and near equal overall solar radiation. Then, on the 12th, fall arrived, as if overnight, with the onset of cooler temperatures, some rain, wind, and fewer sunny days. This allowed the rain shadow to start to kick into gear. For example during the stormy period from the 12th to the 17th, Sequim recorded 5 at least partly sunny days, while Seattle only recorded 2. During the last 19 days of the month, Sequim recorded 17% more sunlight than Seattle, while it was near equal for for the first 11 days. For the first time since April, Sequim's overall solar radiation exceeded Port Angeles, marking a reversal in a summer trend we had observed. On balance though, September was a reasonably sunny month in all locations, with substantially more sunny days that either May or June.
Detailed Study Findings The Port Angeles site recorded 17 mostly sunny days, to Seattle's 14 mostly sunny days.
On average for the month, the
Sequim site had 2.94 hours of clear sunny skies per day, where as Port Angeles
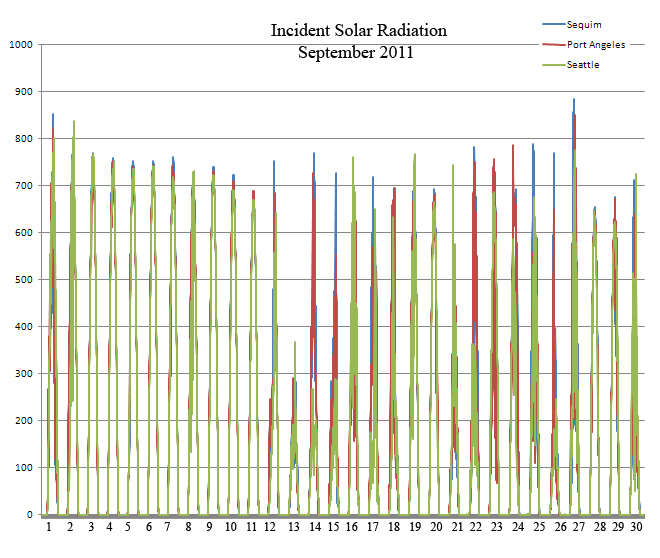
had 2.90 hours, and Seattle had 2.54 hours. In terms of pure solar radiation,
the Sequim site for the month recorded 1.14 times as much overall solar radiation as Seattle
and 1.01 times Port Angeles
Study Conclusion
Appendix
Study Methodology This study was conducted by examining incident solar radiation. Solar radiation is measured in watts per square meter. This measurement is directly related to illuminance, a measure of how much light falls on a given area. We used data from three different weather stations. The first station, the Sequim station, is located on the roof of a single story home on Jamestown Beach Rd, in Sequim, directly on the shores of the Strait of Juan de Fuca. This location may be very close to the epicenter of the Olympic Rain Shadow. As with many locations on the Dungeness plain in Sequim, this one is not shaded by tall trees, nor does it have any hills affecting its exposure. When the sun rises in the morning, it clears the horizon almost immediately as the areas to the south and east are open water. When the sun sets in the evening, it sets to the west, over the Dungeness plain, so stays above the horizon for quite some time. The Sequim location uses a Davis Instruments Vantage Pro 2 with optional solar sensor. This station measures solar radiation every 2 minutes and records the average over 10 minutes. The second station is in downtown Port Angeles, at Lincoln High School. The school's Davis Instruments Vantage Pro2 Plus sensors are mounted on the rooftop of the high school, about a mile southwest of ferry dock to Victoria B.C. at an elevation of about 200 feet. There is excellent exposure clockwise from northeast to southwest and good exposure for the other directions. The sensors record solar radiation every five minutes. Special thanks to Peter Alexander, his math classes, and Lincoln High School for the data and support.. The third station is atop the Atmospheric Sciences Department building of the University of Washington, in the University District of Seattle. This seven story building is not in the classical Olympic Rain Shadow area, but is still slightly shadowed by the Olympics. Given that the sensor is located atop a tall building, this location has ideal exposure and receives maximum solar radiation. This station records solar radiation every minute. Data was retrieved by downloading public information from the University of WashingtonÆs Department of Atmospheric Sciences website. For purposes of this study, skies were defined as follows:
ōClear Sunnyö sensors record at least 60% of the maximum radiation possible
for that day of that year Days were categorized as follows:
"Mostly Sunny Day" over Į the day had at least ōbrightö skies, with at
least 22% of daylight hours ōclear sunnyö. Data was aggregated, analyzed, and graphed using Microsoft Excel. | ||||||||||||||||||||||||||||||||
|
Home Page | Location and Climate | Sunshine Studies | Meteorology | Sequim Weather | Resources | Blog| Photo Gallery | About |